How a Restaurant Feasibility Study Is Prepared: Our GCC Method, Sheet by Sheet (Part 1 of 2)

The short answer. A restaurant feasibility study is prepared in a fixed order, and the order is the method. First the brief and the evidence behind it. Then the money: what the project costs and where the cash comes from. Then sales, built from the menu and the seats, never from a share of the market. Then every cost, from first principles, tested against Gulf ranges. That is Part 1. Part 2 turns those inputs into profit, five years, break-even, a stress test, tax, the written reasoning and a verdict. At Praxis the whole study is one connected model of 26 sheets, so a single change to a rent quote moves the verdict on the last page.
Next step. Read along with the open sample study, or see our fixed-price studies for Dubai and the UAE and for Saudi Arabia: USD 999 for the Verdict for small formats, USD 1,999 for the Proof for one location, delivered in seven working days from the completed questionnaire.
Investors ask us the same question in different words: what exactly am I paying for? Fair question. A feasibility study is usually sold as a PDF with a verdict on the front, and the work behind it stays invisible. So this guide opens the model. Every image below is a sheet from the study of À La Rose, a sample we built to the same standard as a paid study, with the figures exactly as the model calculated them.
One finding to keep in mind as you read. The first lease draft for this café charged 8 percent of sales above AED 15 million. The model flagged it in the cost sheets, because it pushed occupancy cost past the 10 percent red line. The landlord agreed to move the threshold to AED 18 million. That one line is worth about AED 240,000 a year to the partners, every year of the lease. It was found on paper, before anyone signed. That is what the method is for.
The order of work, in fourteen steps
Every Praxis study follows the same sequence. Each step reads from the ones before it, which is why the order cannot be shuffled.
- The brief: concept, seats, area, site, opening date, partners and equity. (Part 1)
- The evidence log: every key assumption tied to a source and a date. (Part 1)
- Sources and uses of cash: how the project is funded. (Part 1)
- The capital budget: every line of the build, costed and classified. (Part 1)
- The sales projection: seats, turns and average check, by meal period and by day. (Part 1)
- The cost engine: food, payroll, rent, utilities and every other line, in the market’s own rules. (Part 1)
- The benchmark test: each cost against the Gulf range. (Part 1)
- Profit and loss after every tax. (Part 2)
- Five-year projections with costs that creep. (Part 2)
- Break-even in dirhams and in covers a day. (Part 2)
- Scenarios, sensitivity and the year-one ramp-up. (Part 2)
- Tax and VAT as cash. (Part 2)
- The Thesis: the written reasoning and the pre-mortem. (Part 2)
- The verdict: scorecard, hard red lines and returns. (Part 2)
Step 1. The brief, and a model that refuses to run half-finished
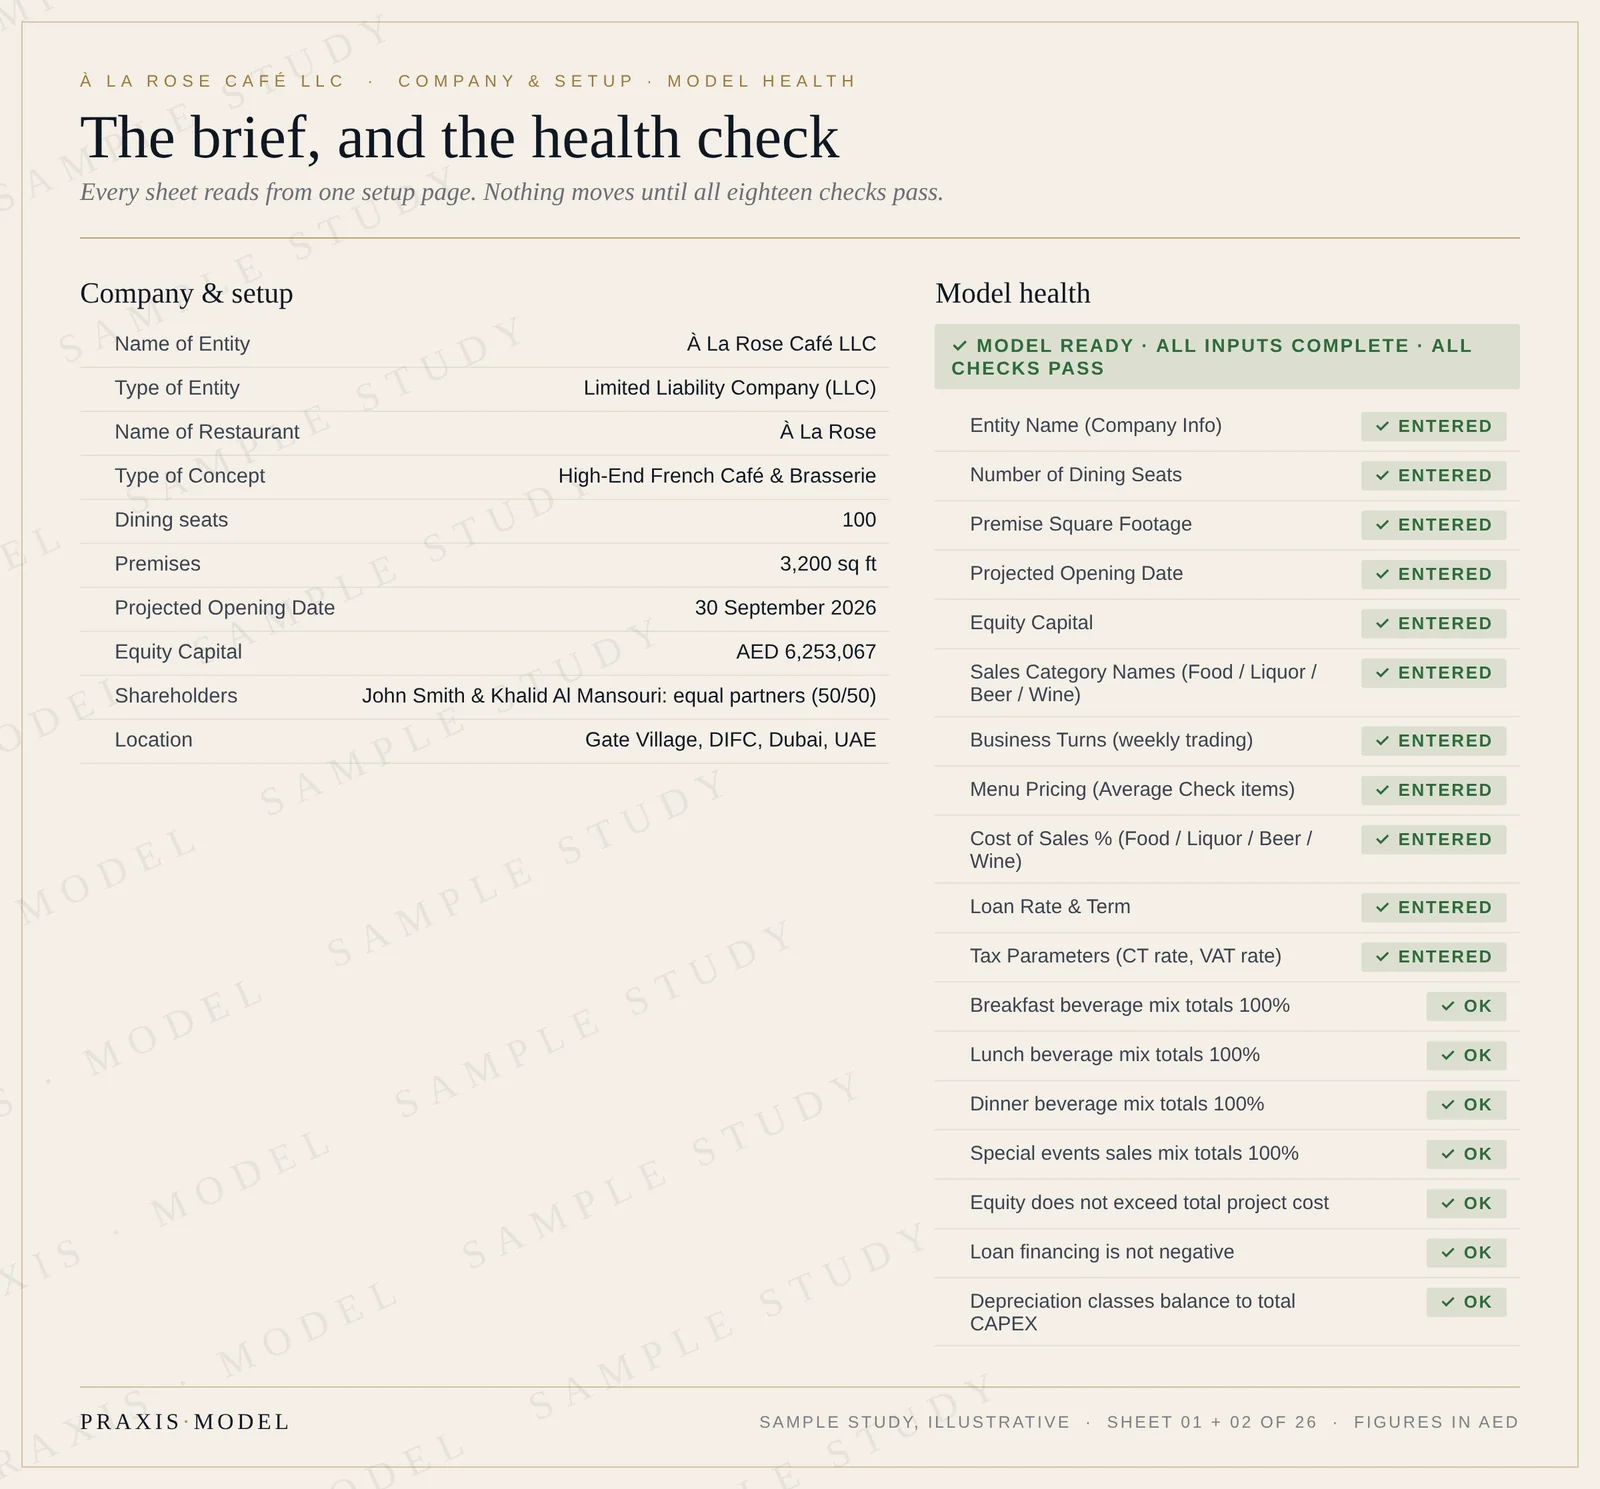
A study starts with a questionnaire, not a spreadsheet. The client tells us the concept, the site, the number of seats, the floor area, the opening date, who the partners are and how much equity they bring. Those answers land on one setup page, and every core sheet reads from it. Rename the company there and the page titles change with it. Change the seat count and the sales, the profit and the margin of safety all move with it.
Next to the setup page sits a sheet clients rarely see in other studies: the model health check. It runs eighteen tests. Eleven confirm that every required input exists, from menu prices to the loan rate. Seven confirm the model is internally honest: each meal period’s drinks mix adds up to 100 percent, equity does not exceed the project cost, the loan is never negative, depreciation classes balance to the capital budget. Until all eighteen pass, the study is not finished, whatever the verdict page says.
Step 2. Every number traces to a source
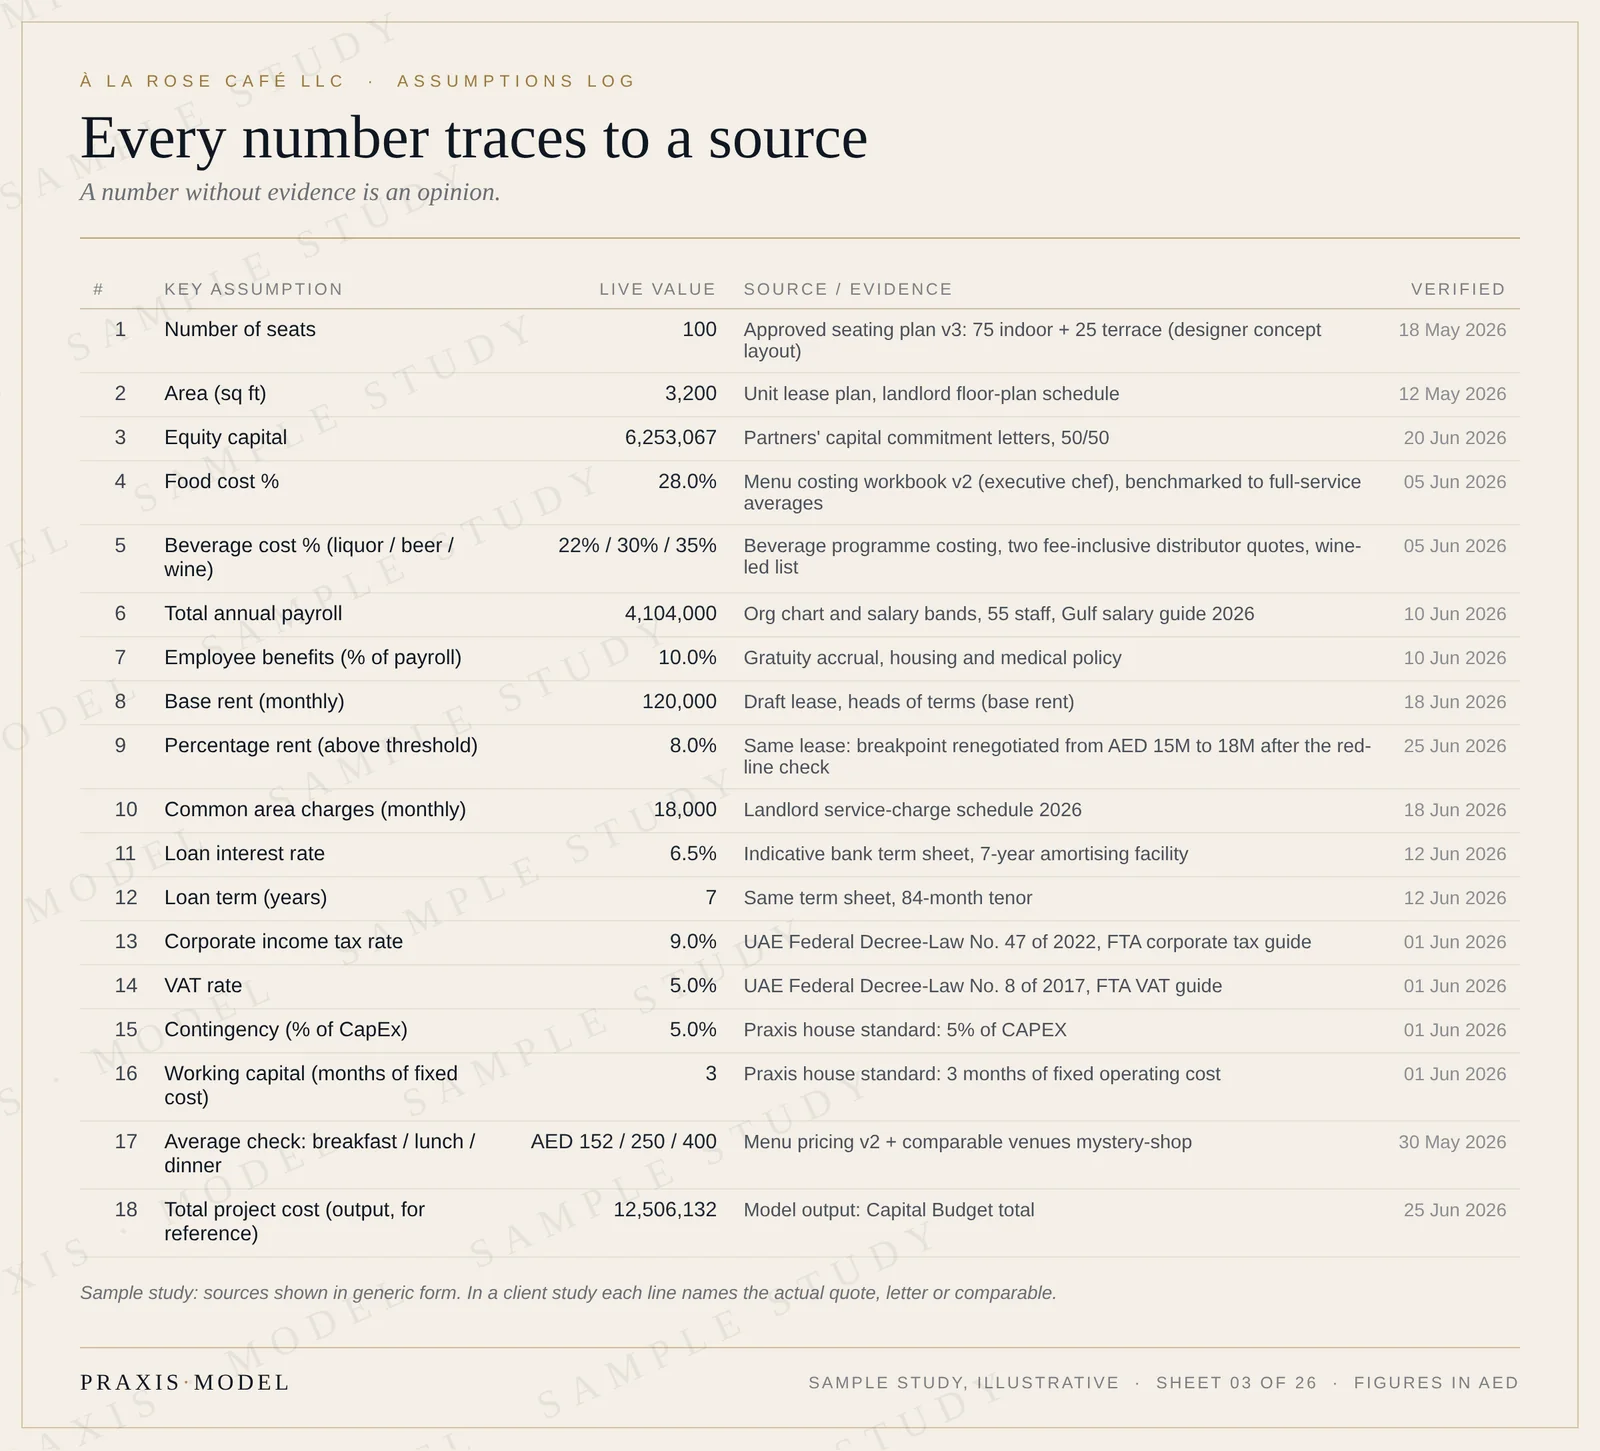
A number without evidence is an opinion. So before any projection, the study keeps an assumptions log: the eighteen figures that drive the result, where each one lives in the model, its live value, the evidence behind it and the date it was checked. Seats come from the approved seating plan. Food cost comes from the chef’s menu costing. Rent comes from the heads of terms. The loan rate comes from a bank term sheet. Tax rates come from the law that sets them.
This page is also where a lender starts asking questions, so we make it easy to answer them. In a client study each line names the actual quote, letter or comparable. In the public sample, the sources appear in generic form.
Step 3. Where the money comes from, and where it goes
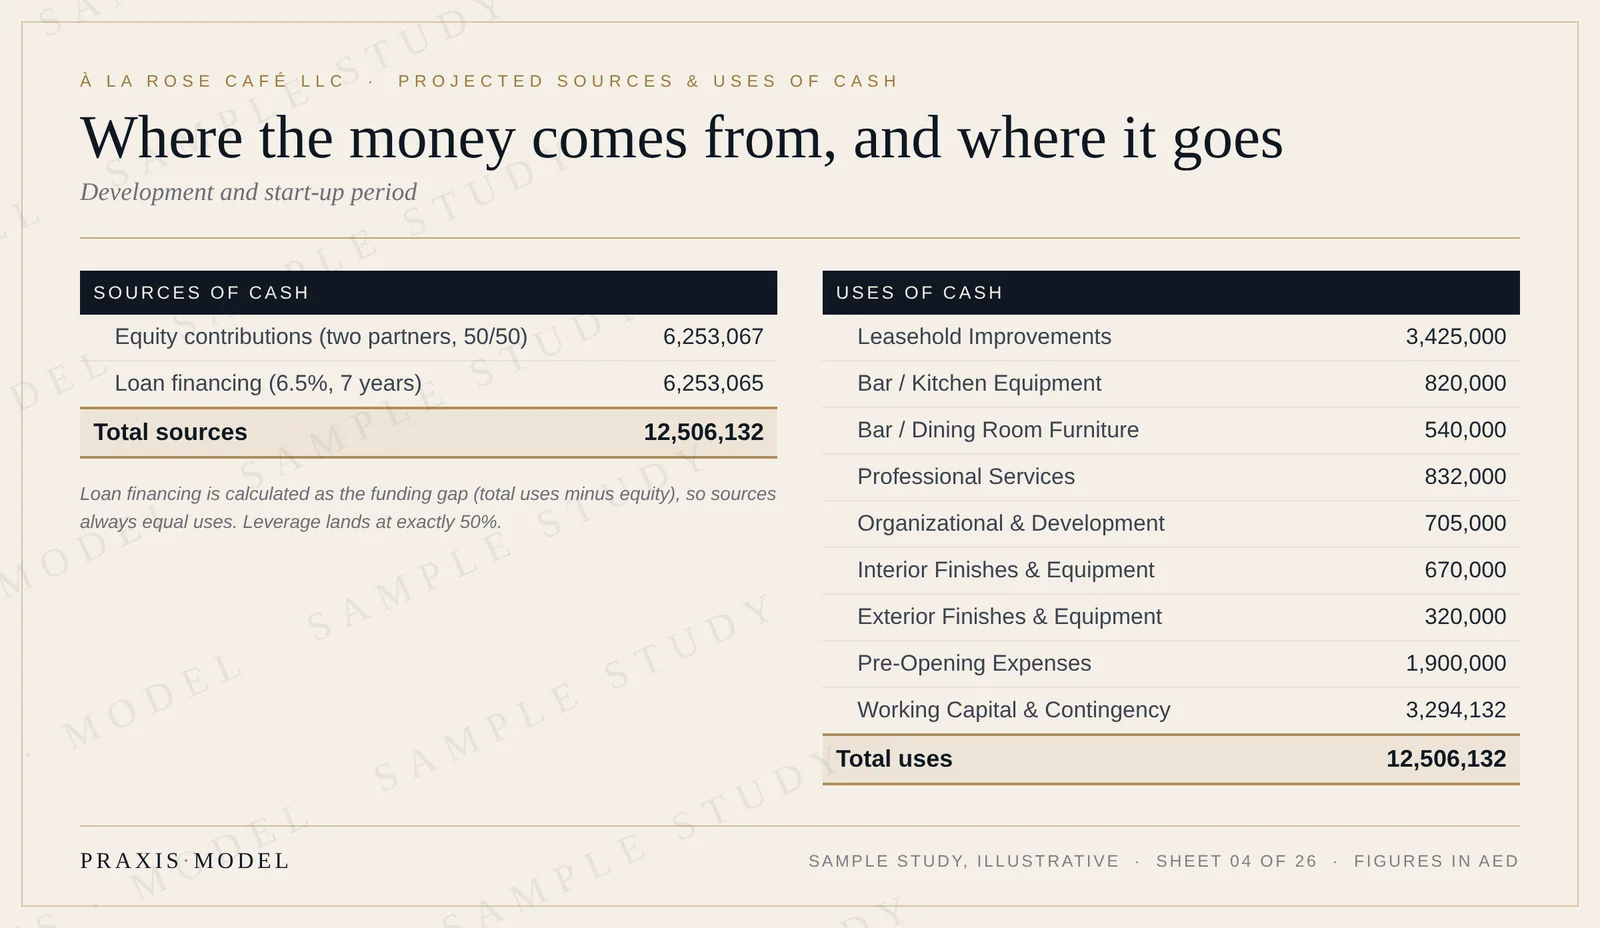
Before the detail, the frame. The sources and uses page answers the first question any investor asks: how much, and from whom. À La Rose needs AED 12.51 million. The two partners put in AED 6.25 million of equity, half each. The model calculates the loan as the gap between total uses and equity, so the two sides always balance and the leverage is visible at a glance: exactly 50 percent here, at 6.5 percent over seven years.
Step 4. The capital budget, line by line
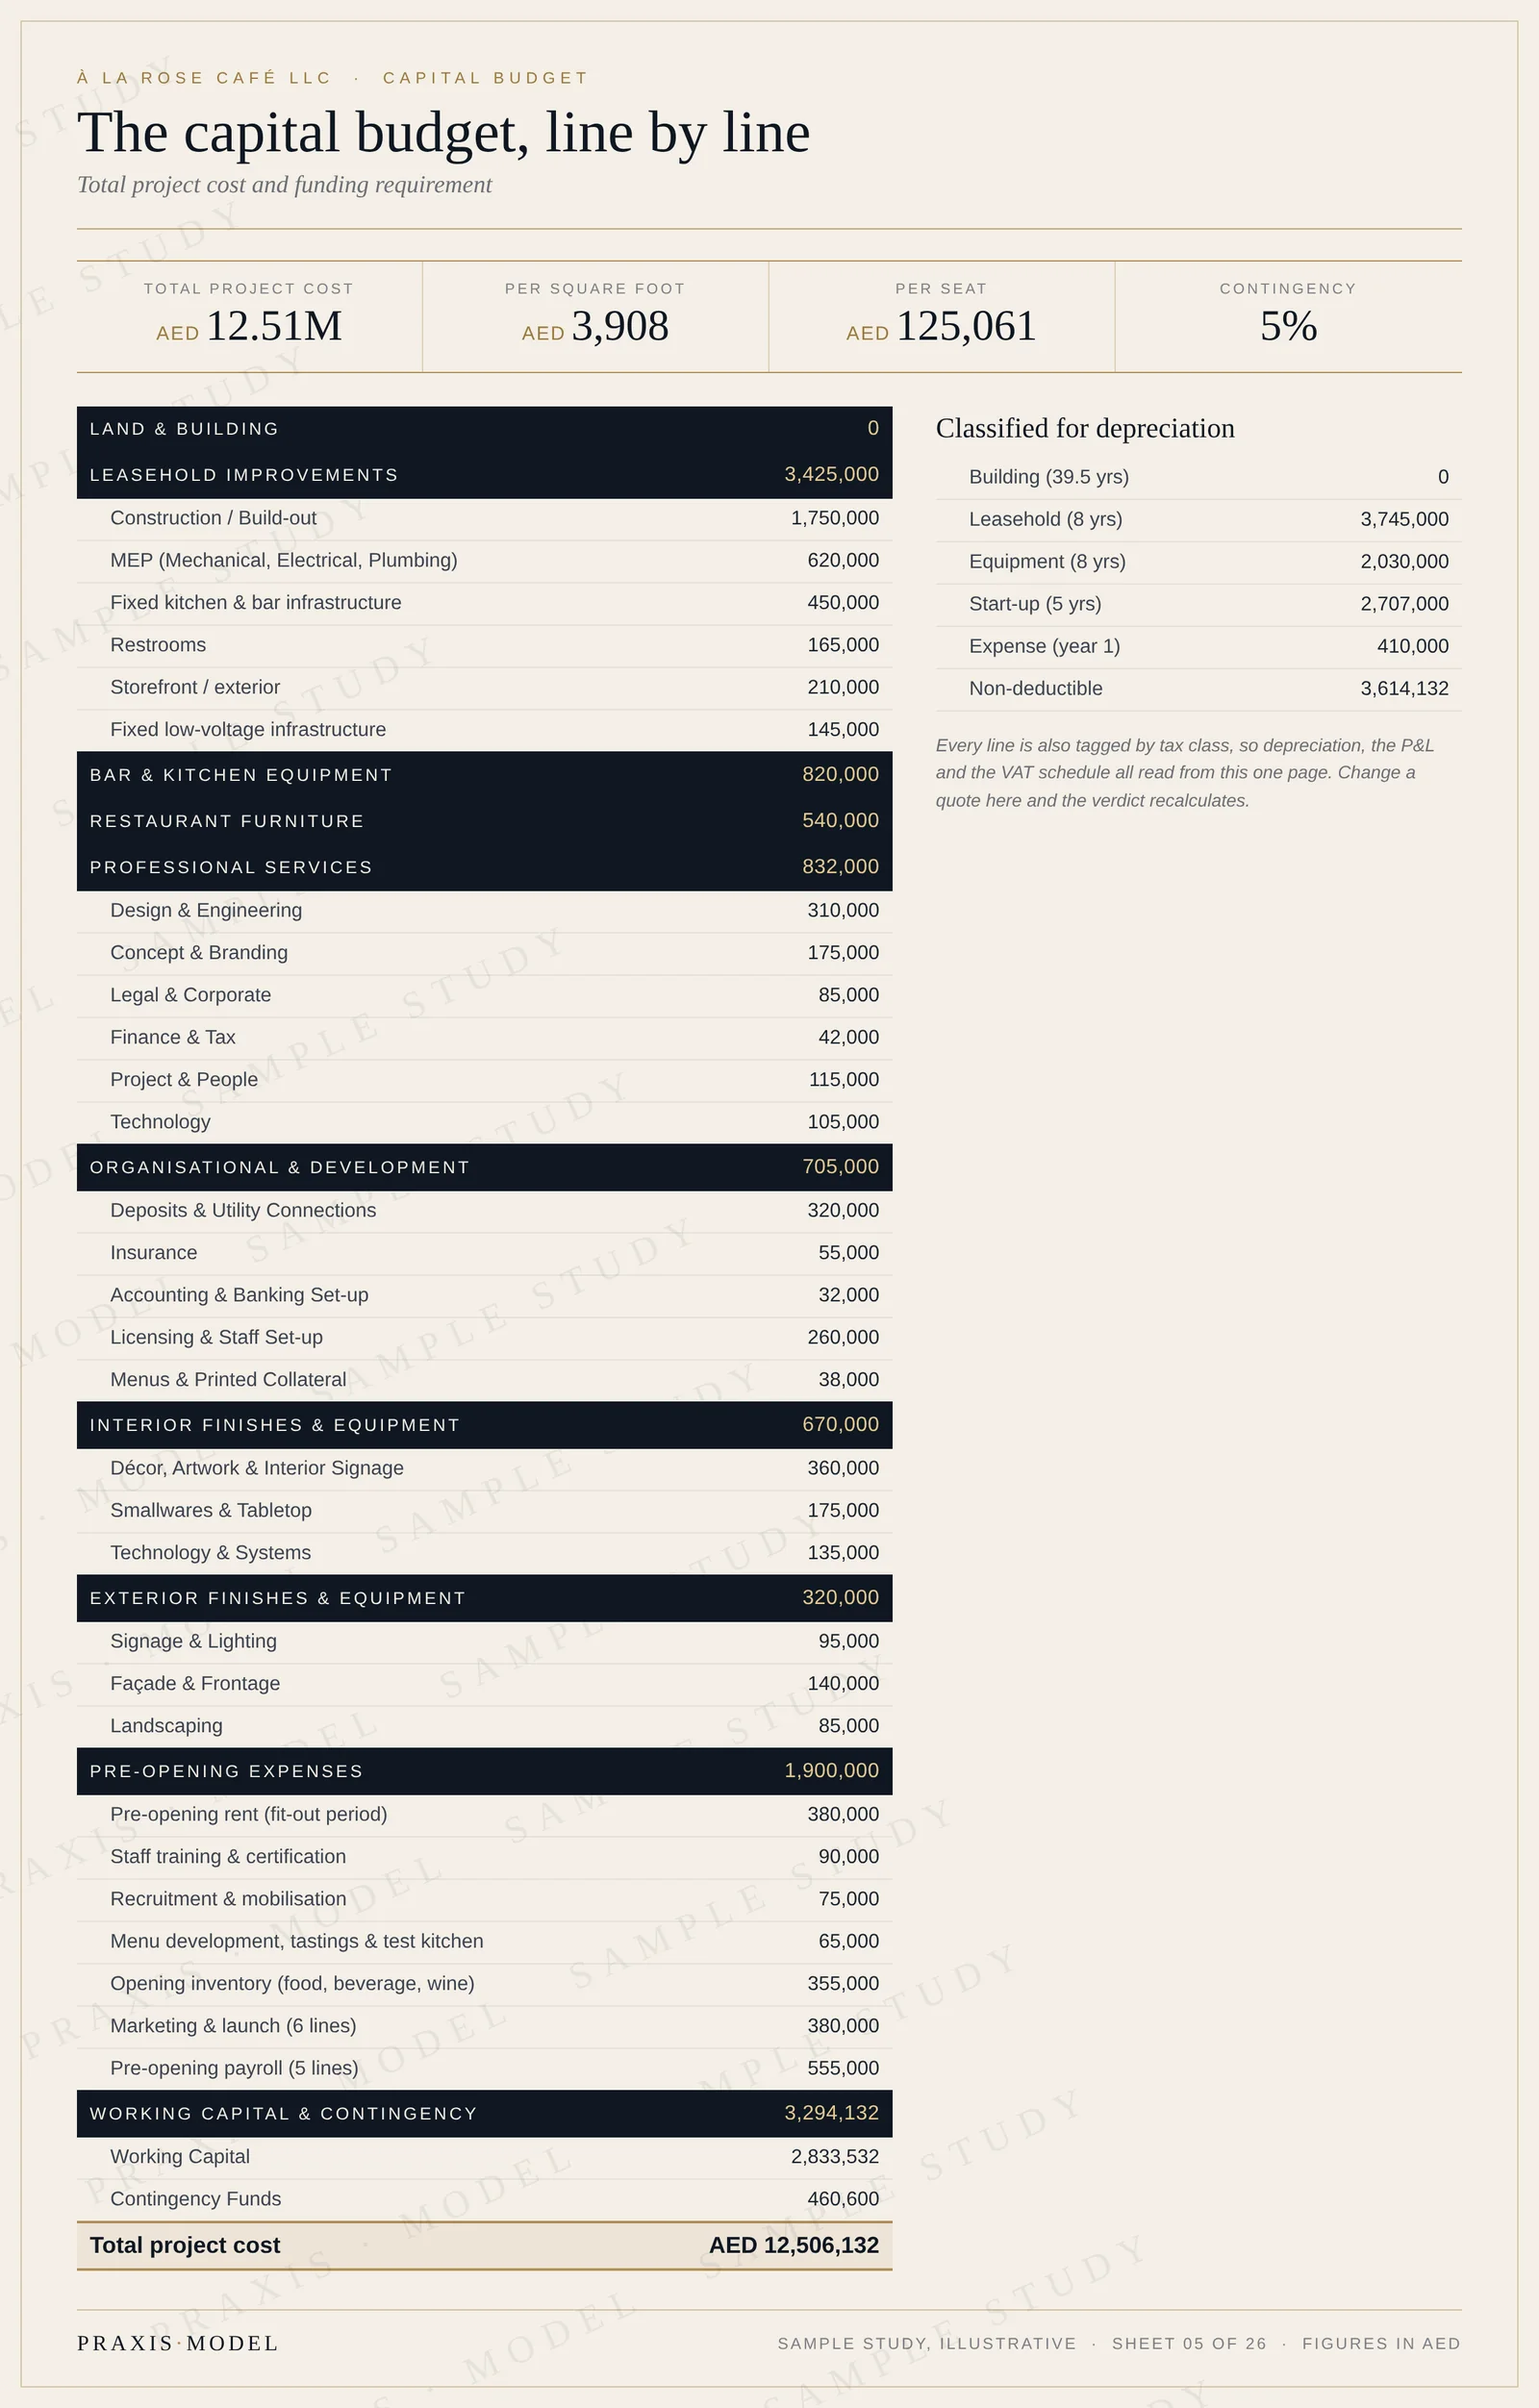
This is where most studies go vague and where most overruns begin. A Praxis capital budget runs in ten sections: land and building (zero here, because the café leases its unit), leasehold improvements, kitchen and bar equipment, furniture, professional services, organisational costs and licensing, interior finishes, exterior finishes, pre-opening expenses, and working capital with contingency.
Three details matter more than they look:
- Pre-opening is its own section. Rent during fit-out, recruitment, training, opening stock, the launch campaign and the opening team’s payroll come to AED 1.90 million here, including a launch budget held to AED 380,000. Founders forget it; landlords and suppliers do not.
- Contingency and working capital are calculated, not guessed. Contingency is 5 percent of the capital budget before working capital. Working capital is three months of fixed operating cost, AED 2.83 million. Change the payroll and the reserve resizes itself.
- Every line carries a tax class. Leasehold works, equipment, start-up costs, immediate expenses or non-deductible items. That classification feeds depreciation, the profit and loss and the VAT schedule, so the capital budget is not a separate document; it is the root of the model.
A companion sheet, the scope notes, defines what each line includes, down to the cabling behind the screens. When three contractors quote, they quote the same scope. The result is reported the way investors compare projects: AED 3,908 per square foot and AED 125,061 per seat.
Step 5. Sales, engineered from the menu
Here is the step that separates a study from a sales pitch. We never forecast a restaurant’s sales as a slice of a market. “The Dubai food market is worth billions; we need only a fraction of one percent” is how optimism dresses up as analysis. Sales are built from the bottom, the way a restaurant actually earns them.
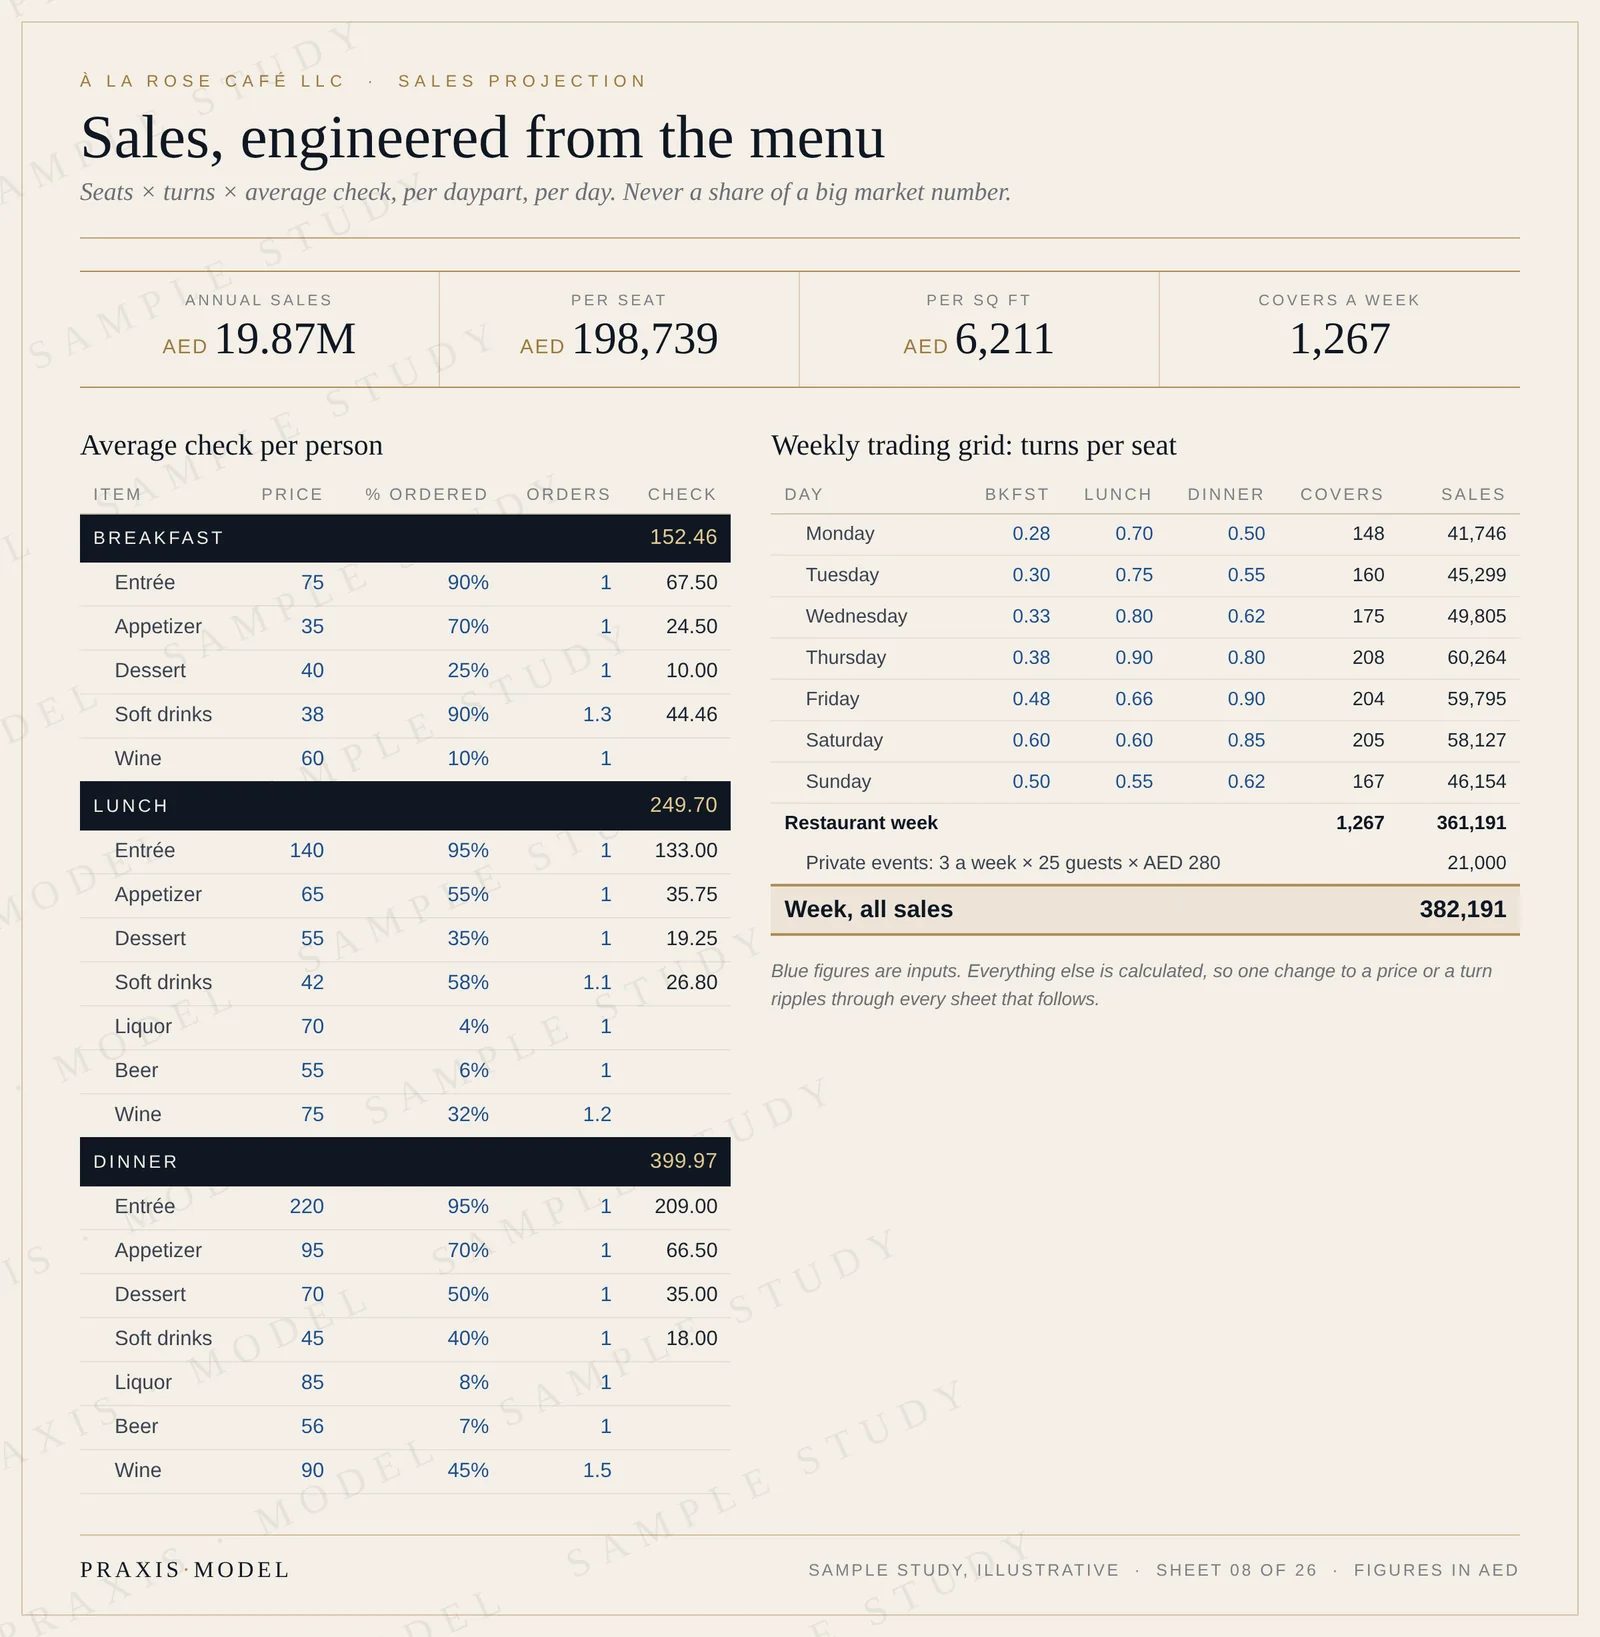
For each meal period, the model prices the menu: the average price of a main course, a starter, a dessert, a soft drink, a glass of wine, and the share of guests who order each one. That gives an average check per guest. At À La Rose it is AED 152 at breakfast, AED 250 at lunch and AED 400 at dinner. Drinks are priced against what five-star DIFC venues actually charge once their service charge and VAT are taken out: coffee and soft drinks at AED 38 to 45, beer at AED 55 to 56. Then the trading grid sets how many times each seat turns, for each meal, on each day of the week. Monday breakfast fills 28 percent of the room; Thursday dinner, 80 percent. Private events go on their own line: three a week, 25 guests, AED 280 a head.
Multiply it through and the week holds 1,267 restaurant covers, 75 event guests and AED 382,191 of sales. A year comes to AED 19.87 million, or AED 198,739 per seat and AED 6,211 per square foot. Only then do we look up, at the market, and ask whether the answer is plausible. Here, 192 covers a day from a weekday district population of more than 40,000, plus the residential evening trade, is a small share of the people within walking distance. If the bottom-up number needs a heroic share of the market, the study says so.
Step 6. The cost engine, from first principles
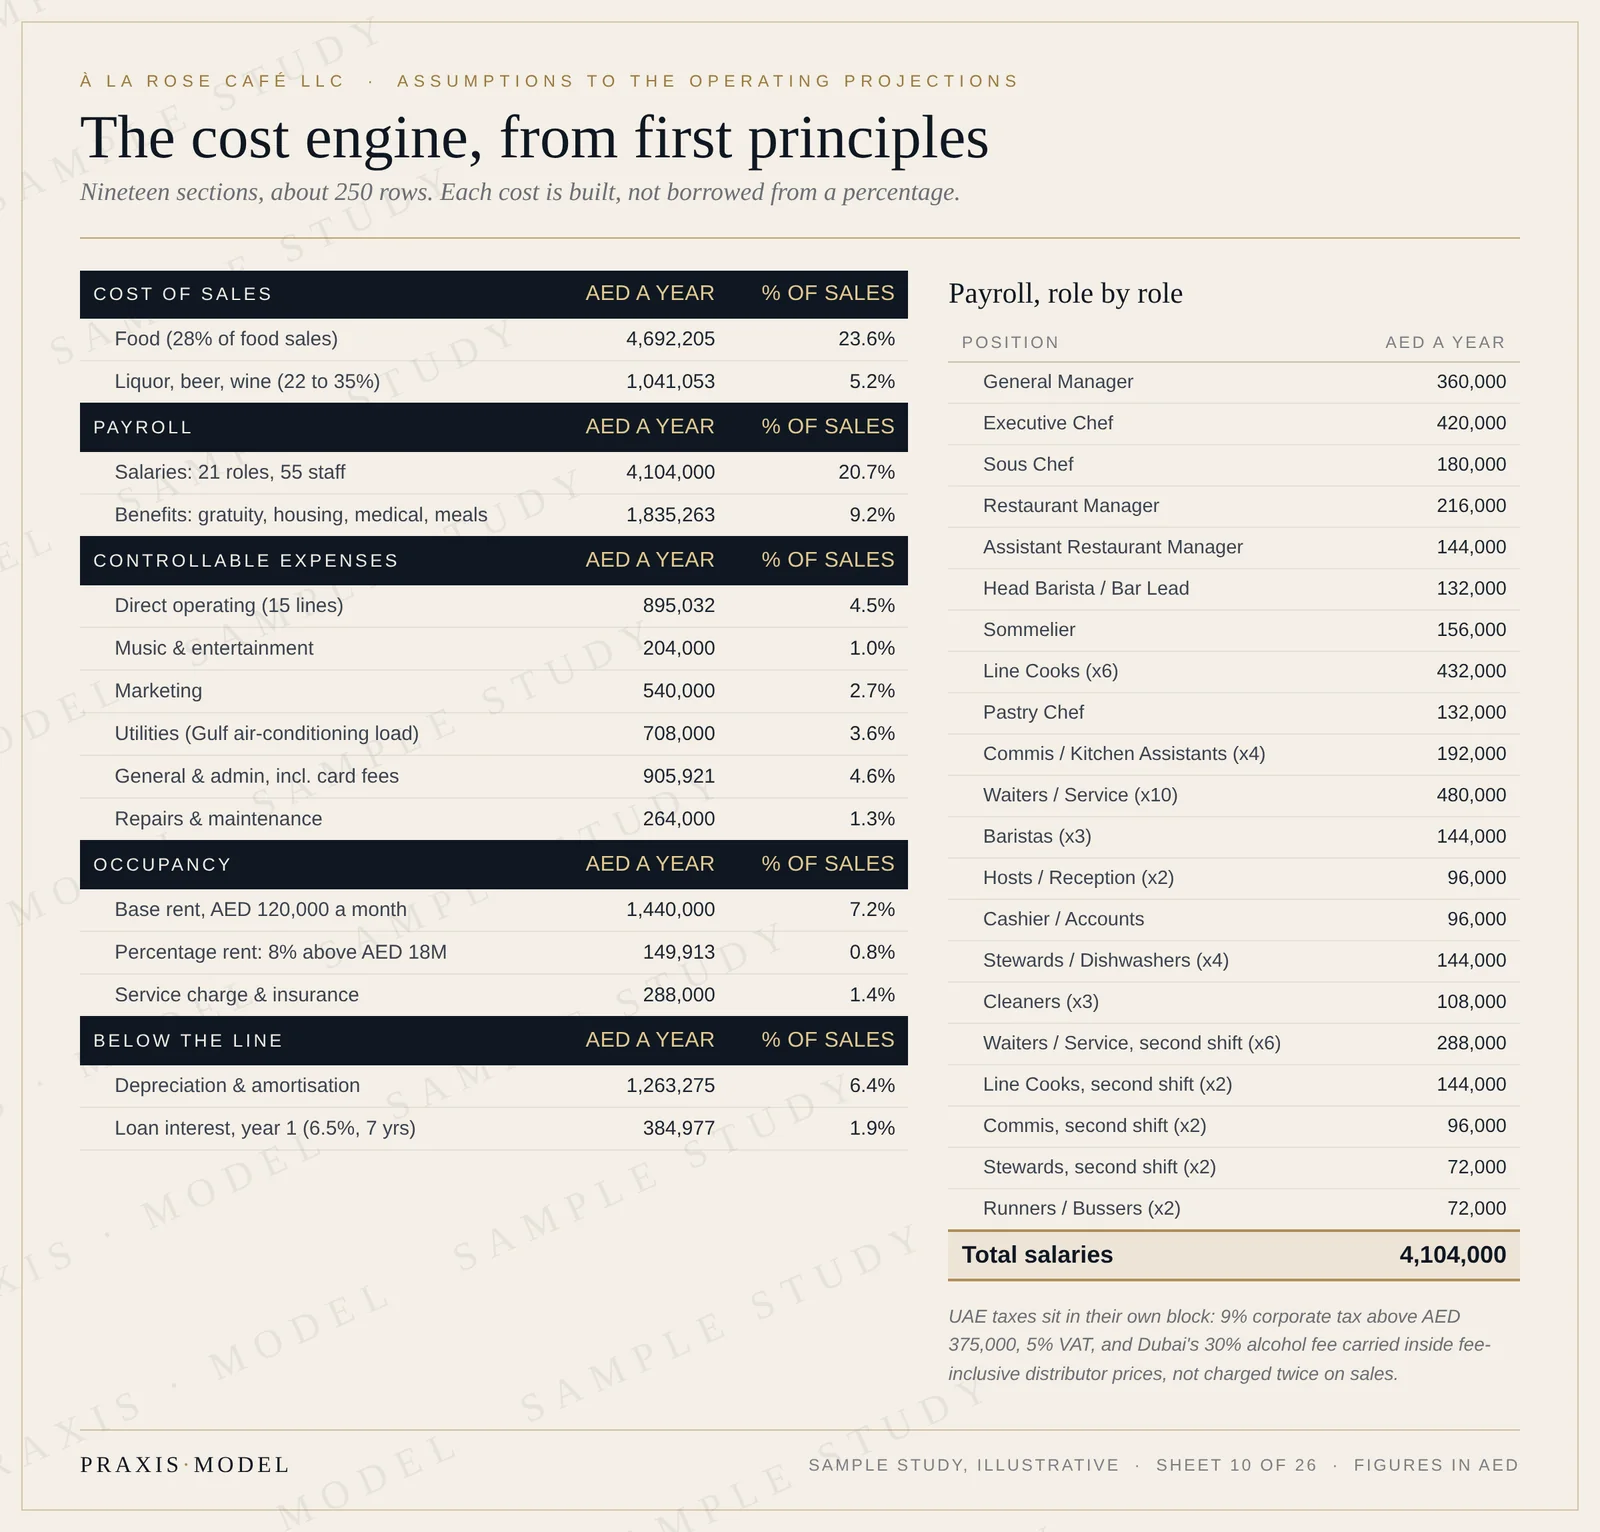
Costs are the longest sheet in the study: nineteen sections and about 250 rows. Each cost is built, not borrowed from an industry percentage, because percentages hide the decisions that make or break a restaurant in the Gulf.
- Cost of sales by category: food at 28 percent of food sales from the chef’s costing, and each drink category at its own rate.
- Payroll, role by role: 21 positions and 55 people, from the general manager to a second-shift brigade for a room that trades from 8am to 11pm, AED 4.10 million a year. Then the Gulf layer that imported templates miss: end-of-service gratuity, staff housing, mandatory medical cover and staff meals. Visas and work permits sit in the set-up budget. Benefits add AED 1.84 million, close to half again on top of salaries.
- Occupancy, with the lease read clause by clause: base rent of AED 120,000 a month, service charge, insurance and the percentage rent we renegotiated.
- Everything else that leaves the bank account: fifteen lines of direct operating costs, music, marketing, utilities sized for the Gulf’s air-conditioning load, card fees on 85 percent of sales, repairs, and the loan schedule month by month for 84 months.
Each market has its own tax and labour rules, and the model carries them in a dedicated block. In the UAE: 9 percent corporate tax on profit above AED 375,000, 5 percent VAT, and in Dubai a 30 percent municipality fee on alcohol. That fee is charged to the licensed distributors and passed on in their prices, so the model carries it inside the drinks cost from fee-inclusive quotes; charging it again on sales would count it twice. In Saudi Arabia the same model runs at 15 percent VAT with Zakat, and every Saudi study prices Saudization line by line. Bahrain, Oman and Qatar each run on their own version of the model, with their own tax regime, currency and labour costs. A model built for one Gulf country is quietly wrong in the next.
Step 7. Every cost, tested against the Gulf range
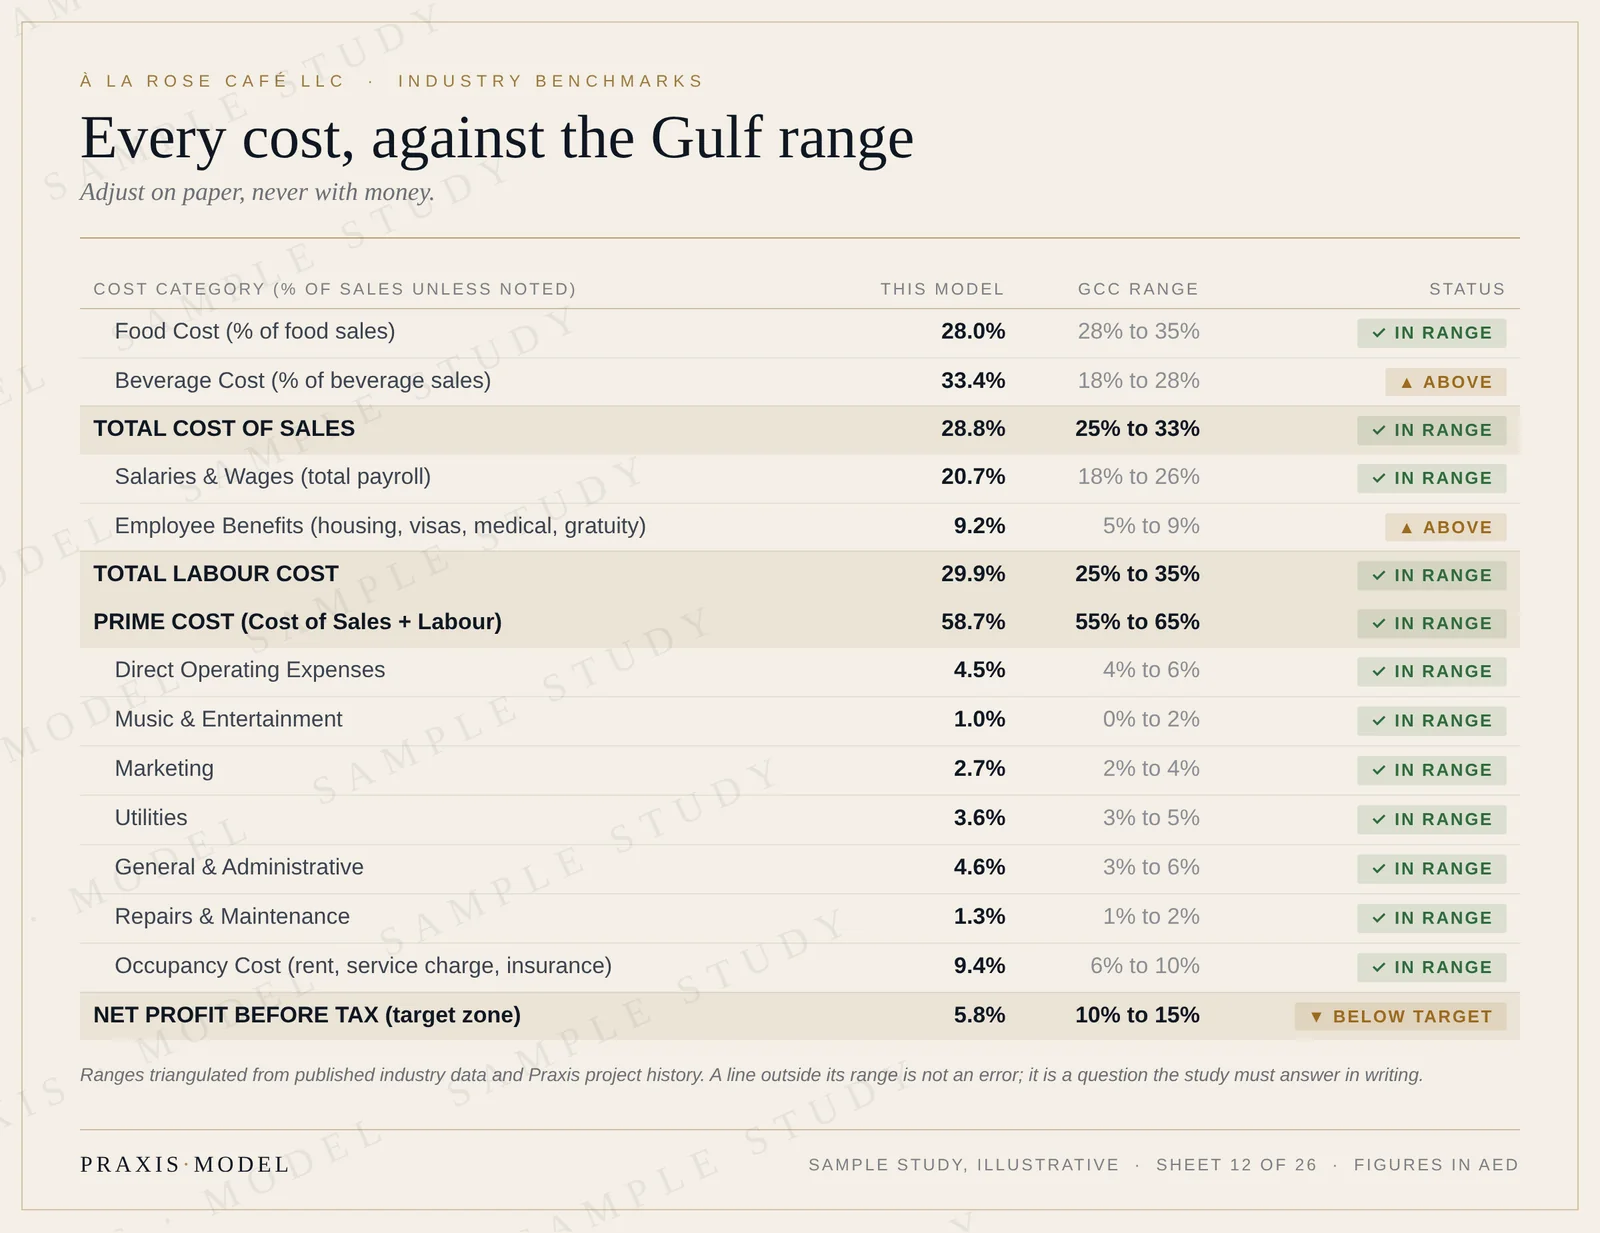
A model can be internally consistent and still wrong. So before any profit is reported, every cost line is held up against the range that full-service restaurants in the Gulf actually run at. Food cost between 28 and 35 percent. Prime cost, meaning cost of sales plus labour, between 55 and 65 percent. Occupancy between 6 and 10 percent. Net profit before tax between 10 and 15 percent.
A line outside its range is not an error. It is a question the study must answer in writing. À La Rose shows three. Its drinks cost runs above range, at 33.4 percent, because the list is wine-led and the prices it pays already include the alcohol fee. Its benefits run above range, at 9.2 percent of sales, because a 55-person Gulf team carries housing, medical cover and gratuity on every head. And pre-tax profit, at 5.8 percent, sits below the 10 to 15 percent target zone. That third line is the one that matters. It says the café works, but with a thin cushion, and a study that buries a thin cushion is not worth its fee. Each answer appears in the Thesis, which we open in Part 2.
What a client sends, and what happens next
Everything above starts from the questionnaire. The client describes the concept, the menu direction and price points, the site or the shortlist of sites, the seat count and area, the budget and how it will be funded. Where a figure is missing, we research it or flag it. The seven working days begin when the questionnaire is complete, and the client sees exactly what was assumed and why, line by line, before reading a single projection.
Part 2 takes these inputs to the end: the profit and loss after every tax, five years with costs that creep, break-even in covers a day, what happens when sales fall 15 and 30 percent, the honest shape of year one, VAT as a cash flow, the written reasoning, and the verdict. Continue to Part 2: from profit to verdict.
Frequently asked questions
How long does it take to prepare a restaurant feasibility study?
At Praxis Model, seven working days from the completed questionnaire for the Proof, and three working days for the Verdict for small formats such as food trucks, kiosks and dark kitchens. Published Gulf timelines elsewhere run from three to eight weeks.
What information do I need to prepare a restaurant feasibility study?
The concept and menu direction, intended price points, the site or shortlist of sites, the number of seats and the floor area, the target opening date, the total budget and how it will be funded. Lease terms and supplier quotes help but are not required at the start; missing figures are researched or flagged.
Should a restaurant sales forecast be based on market size?
No. A reliable forecast is built bottom-up: seats, multiplied by how often each seat turns per meal period, multiplied by an average check engineered from menu prices and ordering patterns. Market size is used afterwards, only to check that the result needs a plausible share of nearby demand.
What is included in a restaurant capital budget?
Leasehold works, kitchen and bar equipment, furniture, professional fees, licensing and set-up, interior and exterior finishes, pre-opening costs such as rent during fit-out, recruitment, training, opening stock and launch marketing, plus contingency and working capital. In the sample study these total AED 12.51 million for 100 seats.
Can I see a complete restaurant feasibility study before I buy one?
Yes. The full sample study of À La Rose is open at praxismodel.io/sample-study, and the Investor Edition catalogue is at praxismodel.io/sample-catalogue. Both use the same model shown in this guide.
The partners of À La Rose saved roughly AED 240,000 a year before they signed anything. Nobody found it by instinct. It was sitting on line 124 of the cost sheet, waiting for someone to build the model in the right order.